Update links
We measure our success by tracking Key Performance Indicators (KPIs) that reflect our strategic, operational and financial progress and performance. They drive the internal management of the business, and some are used to determine how management and employees are remunerated.
Total shareholder return (TSR) %
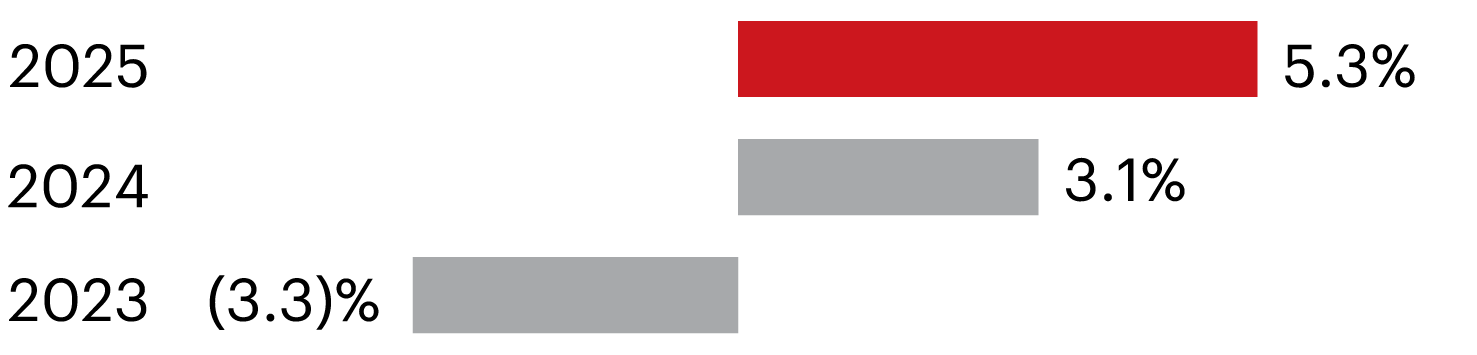
Total accounting return (TAR) %
Rent roll growth £m
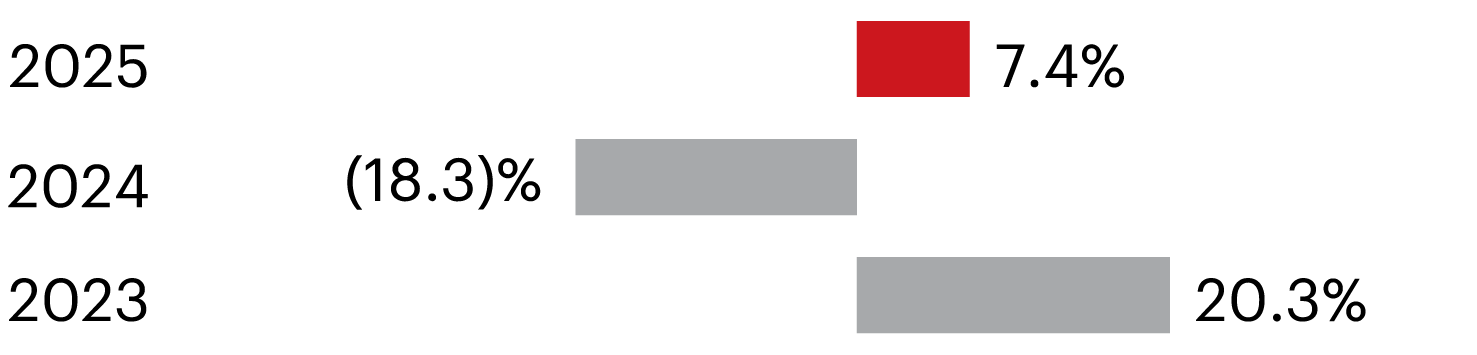

7.4%
Our performance
Our TSR was 7.4 per cent, compared with 11.3 per cent for the FTSE 350 Real Estate index as markets
favoured higher yielding portfolios and near-term
income during 2025. TSR reflects a combination of the 29.9 pence dividend (20.2 pence 2024 final dividend and 9.7 pence 2025 interim dividend) paid during the year, and an increase in the share price from 701.2 pence at 31 December 2024 to 720.4 pence at 31 December 2025.
5.3%
Our performance
Our TAR was 5.3 per cent (2024: 3.1 percent). This performance reflects a combination of the 18 pence increase in Adjusted NAV from 907 pence at 31 December 2024 to 925 pence at 31 December 2025 and the 29.9 pence dividend (20.2 pence 2024 final dividend and 9.7 pence 2025 interim dividend) paid during the year.
£71m
Our performance
In total, we generated £71 million of net new annualised rent during the year (2024: £56 million million). The increase was driven by a record level of rent signed at reviews and renewals and a higher number of pre-lets signed (£26 million versus £20 million in 2024) as occupier sentiment improved during the second half of the year.
![]()
Total property return (TPR) %
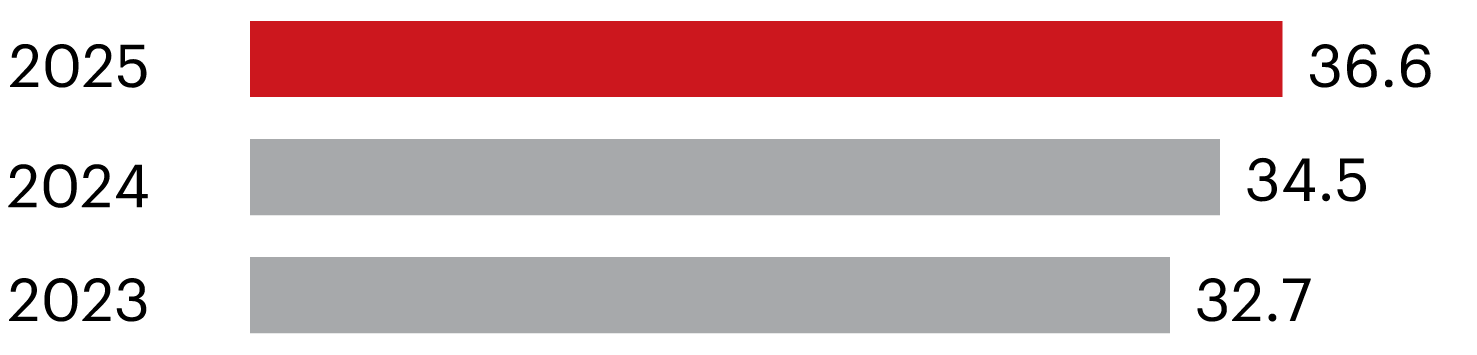
Adjusted earnings per share (EPS) pence
Loan to value (LTV) %
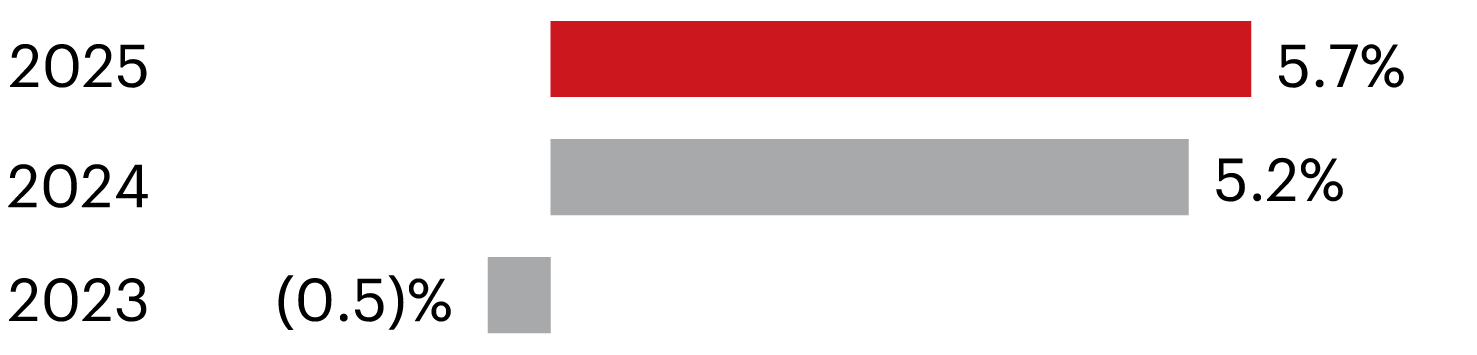
5.7%
Our performance
The TPR of the Group’s standing assets held throughout 2025 was 5.7 per cent (2024: 5.2 per cent). The UK portfolio generated a TPR of 5.2 per cent, behind the benchmark calculated by MSCI Real Estate UK All Industrial Quarterly of 7.2 per cent. The TPR of our Continental Europe portfolio was 5.8 per cent. Benchmark data for Continental Europe will be received later in the year.
36.6p
Our performance
Adjusted EPS increased by 6.1 per cent to 36.6 pence during the year, reflecting higher rental income from our standing assets and new income from acquisitions and developments.
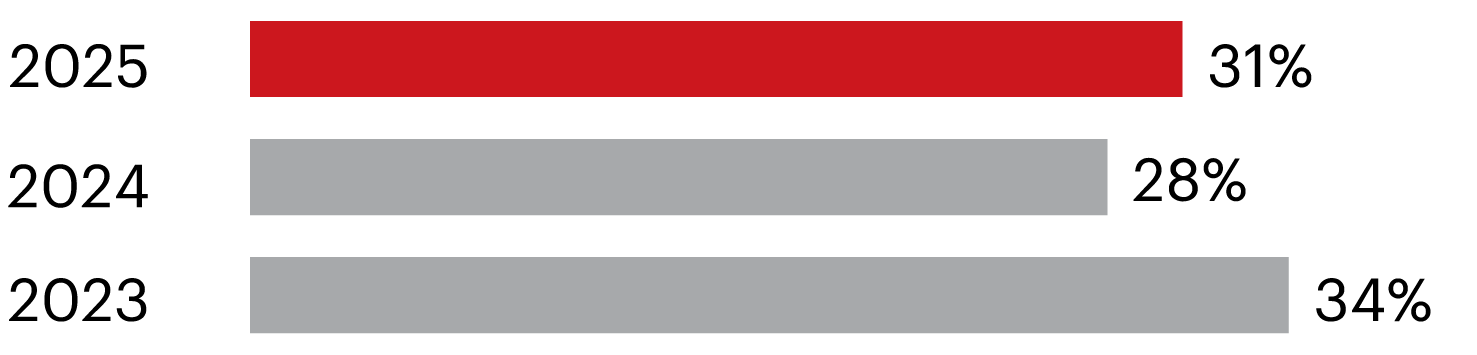
31%
Our performance
Our LTV ratio increased to 31 per cent during 2025. With the value of our portfolio broadly unchanged during the period, this was mostly due to our investment activity, both development capex and asset acquisitions. This is within our leverage tolerance and gives us plenty of liquidity to fund both visible investment and potential opportunities that may arise.